by Sanket Acharya
Abstract :
Induviduals from the bumble bee species Bombus impatiens were
experimented by showing them two targets in a test arena. The targets were
food boxes , one colored blue and the other colored yellow. One of the
food box contained sugar water while the other contained pure water. Some
bees were trained to find food ( sugar water ) in a particular food box.
The time taken by the bees to reach the food from entering the test arena
was measured. A bees first choice of entering a particular colored food
box ( blue or red ) was also noted and this showed the progress in their
learning. Results suggest that color proves to have a significant effect
on the navigation process of bumble bees.
Introduction :
I became interested in the subject of Animal Behavior after reading an article on Konrad Lorenz. His experiments with ducks attracted me to do some such work . We all know honey bees which have been experimented for many years. The foraging behavior and color identification in honey bees has been successfully studied by Karl Von Frish who also deciphered their dance language ( 1969). I got an opportunity to study the behavior of Bombus impatiens a species of Bumble bees under Prof. Fred Dyer at Michigan State University.
Bumble bees have colonies which are much smaller in order of magnitudes as compared to honey bee colonies. A bumble bee colony may house only over a 75-100 induviduals while a honey bee colony houses between 5000 10,000 or more. Bumble bee nests consist of cells and storage pots and structures made from a mixture of wax and pollen. Bumble bees often nest in abandoned burrows of rodents such as field mice. The burrow in the ground leads to the nest. Bird nests, especially if made in cavities are also used in a similar way. The colony consists of a queen and rest workers. Mating with males takes place either in the nest or outside the nest on a flower , fencepost , tree trunk or on a rock. The life cycle of bumble bees starts with the egg , larva , pupa and then the adult . A bumble bee colony can rarely survive over a year.
So far , many experiments regarding color identification and learning of positions ( left or right ) in Honey bees have been done and we were curious to perform similar experiments on bumble bees . In doing so , we tried to study weather Bumble bees can distinguish between colors , understand positions of food source ( left or right ) and use them in Navigation. The species selected for study was Bombus impatiens. There are 13 bumble bee species belonging to the genus Bombus.
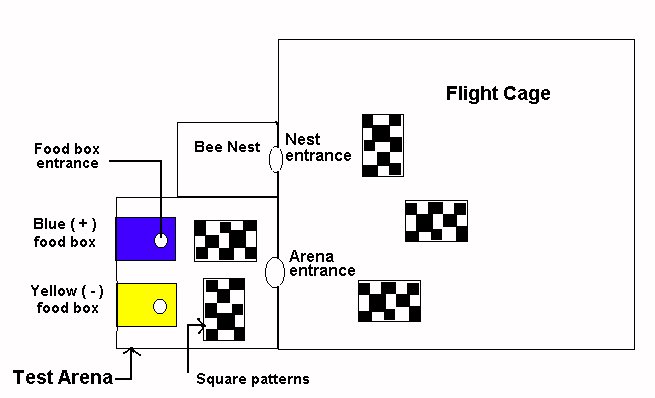
Experimental Setup :
The experimental setup consisted of a hive ( bumble bee nest) , a flight
cage ( where the bees could fly freely ) and a test arena ( in which the
experiment was done ).
See figure 1. Some computer generated black and white square patterns
were placed on the floors of the flight cage and the test arena so that
the bees can navigate themselves better.
There were two targets in the arena for the bees. One , blue and the other yellow. These targets were actually colored cardboards which were attached to a foodbox through way of a tunnel. Unsented sugar water was placed in a cap in the blue food box . As the blue food box contained the food , blue was called the rewarding stimulus. Yellow contained pure water.
The blue food box was on the right side of the bees when they entered
the arena. Yellow was on their left. Bumble bees were trained to
come into the arena , feed on the cap in the foodbox and return to the
nest. The training process was step by step. We first attracted the bees
towards the area which had the entrance of the arena. Next , the bees were
fed on sugar water on a cap at the entrance hole to the arena. Later the
food was kept in the test arena. Then on the entrances of the food boxes
and finally the bees were attracted into the food boxes. Bees were marked
with oil paint to recognize them individually.
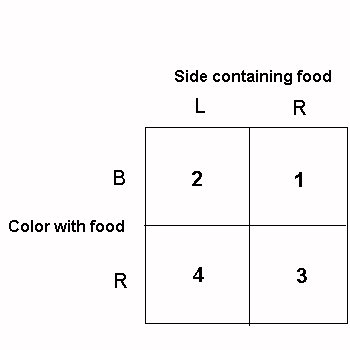
After the bees were used to find food in the arena four treatments were performed on the bees. The treatments included testing the bees with alternate combinations of two colored food boxes blue and yellow and two positions of these food boxes right or left. B+ to right indicates blue food box ( B) to the right in the test arena which is the rewarding stimulus. So the other three combinations were ( 1 ) B+ to right ( 2 ) B+ to left ( 3 ) Y+ to right and ( 4 ) Y+ to left. See Table 1. The four treatments administered were in the sequence indicated in the table. When blue food box , containing food was to the right , yellow food box which had plain water was to the left. When blue food box containing food was to the left yellow food box containing plain water was to the right. The opposite was true when yellow was the rewarding stimulus . The bees were allowed to enter the arena and choose the food box which contains sugar water based on their earlier memory.
The purpose of the experiment was to see if bumble bees can recognize and distinguish colors. The approach of the experiment was to record the cumulative number of correct choices that a bee makes to find the sugar water. Two observations on induvidual bees were noted. First , time taken by a bee to reach the feeding cap in the food box placed in the arena from entering the hole. Second , the choice that the bee makes right or wrong. For example , lets say yellow food box to the right contains food . A bee WTGA ( White thorax , Gold abdomen ) makes six trips to the yellow food box. Out of the six , three trips are correct first choices , which means WTGA directly entered Y+ to the right. The rest three were incorrect first choices which means the bee first entered or hovered over the blue food box ( that did not have food ) and then chose to enter yellow. We had no control over the bees so the bees which entered were observed.
Data Analysis and Interpretation :
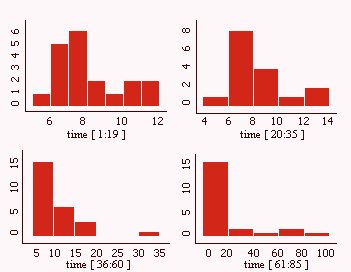
As a first step towards data analysis Histograms were prepared using S+ computer package.In the following Histograms , data on flight times under specific treatments is presented. The X axis shows the time taken by the bees and Y axis represents number of bees.
If we look at histogram no. 1 there are four bees in the right tail which appeared to have unusual high values. These bees were taking more time to reach the food source as compared to the other . In histogram I , these bees can be seen as those taking more than 10 seconds to reach the food source. We went back to our data and identified these bees . They were BT ( Blue Thorax ) , OTOA ( Orange Thorax , Orange Abdomen ) and WTGA. In histogram II another two bees OT ( Orange Thorax ) and WTGA were identified with flight times more than 12 seconds.
( I ) ( II )
( III ) ( IV )
Figure 3 Histograms I IV : X axis represents flight times taken by the bees to reach the feeding cap after entering the test arena . Y axis shows number of bees.
WTGA was also observed to be taking unusually long time according
to Histogram III ( 30 + sec). YTGA , YT ( Yellow Thorax ) and OT were identified
in histogram IV as bees taking more than 60 seconds to find the food. Due
to these peculiar bees the mean time of all the bees especially in histogram
IV inflated. After removing these bees from the data the mean time taken
by the bees decreased from 21.99 to 13.31 .
The observations regarding the correct choices made by the bumble bees
were recorded for over 10 bees and the following data was obtained. The
four treatments
( explained above ) were administered on the bumble bees in the sequence
indicated in Table 1 . Table 2 suggests that the maximum reduction
in making correct choices is from treatment 1 to treatment 2 and not from
treatment 2 to 3.
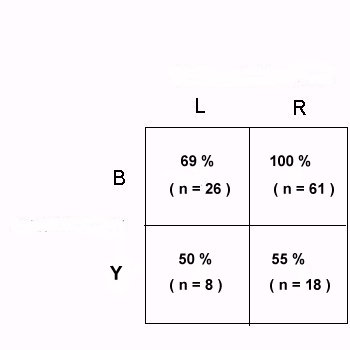
When rewarding stimulus blue was changed from right to left ( in table
1 , Square 1 to square 2. ) the reduction in making correct choices was
100 69 = 31 % .
But when the rewarding stimulus was changed from yellow to blue ( table
1. square 2 to square 3 ) the reduction was 69 55 = 14 % This may be
attributed to the change in color. It is interesting to note that during
treatment 2 and treatment 3 change had been made from B to Y and L to R.
The above observations may suggest that the bumble bees relied more on
position of the cards ( left or right ) rather than the color in the decision
making. However replication of this experiment needs to be done to confirm
these results.
Analysis of Variance ( Annova ) was done using S+ computer package. The results are presented in Tables 3 and 4.
> summary(a)
|
|
|
|
|
|
|
|
|
|
|
|
|
|
|
|
|
|
|
|
|
|
|
|
|
|
|
|
Annova Table 3 : Color effect of the food boxes significant. Position effect of the food boxes marginally significant. No effect of interaction between color and position. ( Refer to the highlighted numbers. A number less than .05 is considered significant.)
|
|
|
|
|
|
|
|
|
|
|
|
|
|
|
|
|
|
|
|
|
|
|
|
|
|
|
|
Thus , it seems that color of the food boxes play a significant role in the decision making of the bees while the positions of the cards are proved insignificant after the removal of three outliers. Also , the median of the time taken by the bees to reach the food source was somewhat more when the food source was to the right. This can be seen through the following data Annova Table 4 : The table above reports analysis after deletion of 3 bees with values 63 , 67 , 70 seconds ( Highlighted above ). These bees were identified as outliers after visual inspection of the plot of residuals. After the deletion of the outlier bees color of food boxes is highly significant as opposed to position of food boxes which is not significant . Interaction between color and position not significant.
Blue food source to the left.
> summary(time[1:19])
|
|
|
|
|
|
|
|
|
|
|
|
|
|
Blue food source to the right.
> summary(time[20:35])
|
|
|
|
|
|
|
|
|
|
|
|
|
|
Yellow food source to the left.
> summary(time[36:60])
|
|
|
|
|
|
|
|
|
|
|
|
|
|
Yellow food source to the right.
> summary(time[c(-1:-62,-70)])
| Minimum | 1st Quarter | Median | Mean | 3rd Quarter | Maximum |
| 6.12 | 8.185 | 10.18 | 13.31 | 13.35 | 50.62 |
Table 5 : ( above ) The highlighted values show that the median of the time taken by the bees to reach the feeding cap after entering the test arena was slightly greater when the food source was to the right. The mean time taken by the bees to find the food by using blue color as a reference is less as compared to yellow.
Table 6 : The presentation below also conveys the slight median
difference.
| Median values when food source was to the left. | Median values when food source was to the right. |
| 7.56
9.53 |
7.465
10.18 |
Table 7 : The presentation below shows the difference
in the mean time taken by the bees to find the food by using blue as a
reference and then by using yellow as a reference. Values are approximate.
| Mean time taken by the bees to find the food by using blue as a reference . | Mean time taken by the bees to find the food by using yellow as a reference . |
| Blue to the left : 8.08
Blue to the right : 8.24 |
Yellow to the left : 11.23
Yellow to the right : 13 .31 |
Future Work :
The experiments done above and the observations recorded were a learning experience for me and a testing for Prof. Dyer to see if such behaviors can be studied in Bumble bees. The above experiments were performed with regard to the bees responses to color stimuli. Similar experiments need to be done on B. impatiens to test their responses to stripped patterns and landmark clues.
Testing stripped patterns on bumble bees will include showing the bees a color rewarding stimulus ( lets say , blue and yellow ) and , vertical and horizontal stripped patterns. Each stripped pattern would be associated with a color in such a way that when blue colored food box contains food it will have vertical stripped patterns associated , while ,when yellow colored food box contains food it will have horizontal stripped patterns associated. The stripes would be placed at the entrance of the test arena so that the bees see the pattern before entering the arena. The bumble bees would have to learn that food will be found in blue when the stripped patterns shown are vertical and , food will be found in yellow when stripped patterns shown are horizontal. Thus it is possible to substitute positions ( left or right ) by stripped patterns.
Experiments on bumble bees with regard to landmark clues will be similar.
Instead of stripped patterns the bees would be shown an arrangement of
landmarks in the test arena. The arrangement of landmarks will be complementary
to the food found in a particular colored food box. The bees will have
to remember this arrangement and accordingly find food in the food boxes.
These experiments would be more complex than the once performed above.
Acknowledgments:
The subject of animal behavior grew on me after reading " Survival Strategies " a book by Prof. Raghavendra Gadagkar of the Center for Ecological Sciences , Indian Institute of Science , Bangalore. His book introduced me to this subject and a visit to his lab made the subject more interesting. I thank him for the same. I also thank
Prof. Fred C. Dyer of Michigan State University for giving me this opportunity
of working in his lab with bumble bees. The experiments were designed by
him . My gratitude also goes to Prof. Anil Gore , Statistician at University
of Michigan for helping me analyze the collected data . He is originally
from Pune University and has been a source of inspiration for me. Am grateful
to Mr. Roshan also from University of Michigan who recommended the use
of S+ computer package for the statistical analysis and then helped us
work with it. Finally , I express my thanks to Micah Gill ( a technician
under Prof. Dyer ) Sujata Kardile ( student of Prof. Gadaghkar ) , Prof.
L.P Sharma from HPT / RYK college , Nasik and my father Prof. S. L Acharya
from S. M. R. K. college , Nasik , India for their encouragement and generous
support from time to time.
References :
1 ) "Bumble Bees and their Ways" by Otto Emil Plath.
The McMillan company , 1934 , New York.
2 ) "The Social Behavior of the Bees."
A comparative study by Charles D. Michener.
Belknap Press of Harvard University Press , Cambridge , Massachussets, 1974.
3 ) "Survival Stratigies" by Prof. Raghavendra Gadagkar.
Universities Press , India 1998.